
DATA Series
Sea Nettles: What Are the Chances?
- Lesson Time : 45 minutes
- Grade Level : 6-12
- Vocabulary: salinity, brackish, species distribution, data bouys
- Data Source: Chesapeake Bay Environmental Forecast System (CBEFS)

Celia Cackowski
Author
Subject Area
Ocean Observing, Biology & Ecology
Environmental Forecasting
Focus
Download PDF
Summary
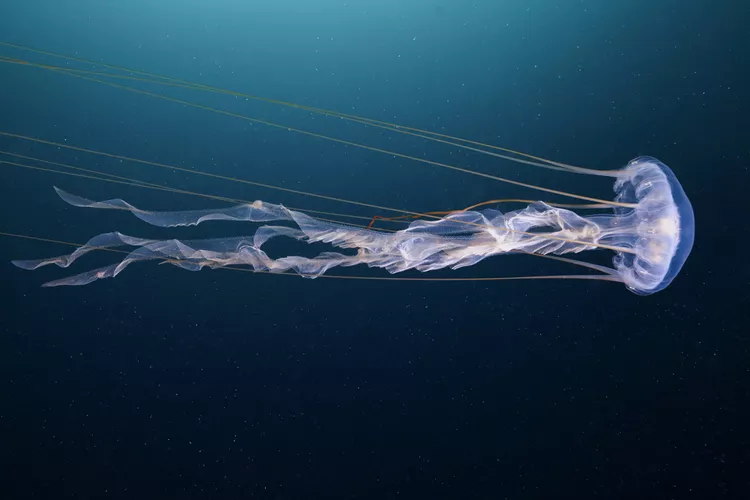
While an important food source for local sea life, many swimmers and recreational fishermen consider sea nettles a pest. Why? Because their tentacles pack a powerful sting. But how can beachgoers avoid them? In this exercise, students will use both both forecasting tools and buoy data to determine the temperature and salinity ranges most likely to result in a bloom of nettles in Chesapeake Bay.
Objectives
- Locate ocean observing data using computer skills and the Internet.
- Generate a line graph to illustrate water temperature trends for a given location.
- Observe and identify variations in sea nettle probability, salinity, and sea surface temperature.
Introduction
Sea nettles are carnivorous jellyfish that feed on zooplankton, ctenophores, small fish, and ocassionally crustaceans. Their main predators are sea turtles, ocean sunfish, and larger jellyfish. Along the Atlantic seaboard of the United States, there are two recognized species: the Atlantic sea nettle (Chrysaora quinquecirrha) and the bay nettle (Chrysaora chesapeakei). The bay nettle is usually white and occurs most abundantly in the brackish tributaries of the middle Chesapeake Bay, where salinities range from 10 to 20 parts per thousand (ppt). In the southern Bay, it can have red/maroon markings on the long central tentacles and on the swimming bell.
In the Chesapeake, nettles are most likely to appear between May and October. When large numbers of these jellyfish appear at one time, it is called a “bloom.” While an important food source for local sea life, many swimmers and recreational fishermen consider sea nettles a pest. Why? Because their tentacles pack a powerful sting. Nettles have been known to break up more than one trip to the seashore, but how can beachgoers avoid them?
Researchers at the National Oceanic and Atmospheric Administration (NOAA) and the Virginia Institute of Marine Science (VIMS) have been working on a tool to help predict where and when nettles are most likely to appear. These predictions are based on salinity and water temperature. In this exercise, students will use both both forecasting tools and bouy data to determine the temperature range most likely to result in a bloom of nettles in the Bay.
Data Activity
First, locate each of the eight observing stations on a map of the Chesapeake Bay:
- Patapsco
- Annapolis
- Gooses Reef
- Potomac
- Stingray Point
- York Spit
- First Landing
- Jamestown
Next, download the provided Probability Models for each month (May-October) and answer the following questions.
1. What do you notice about the models from month to month?
2. What do these variations mean in terms of sea nettle probability?
3. What month and location seem most likely to have sea nettles?
Now compare the probability models to the CBIBS buoy map and select a station to run water quality parameters for. Once you have selected your station, visit the Chesapeake Bay Interpretive Buoy System (CBIBS) website and navigate to their Data Graphing Tool. Select a date range that begins in May and ends in October. Then select your chosen station from the dropdown. Finally, select your parameter (first salinity, then water temperature)and click “Load.”
Based on the graphs of your salinity and water temperature, answer the following questions:
1. Which parameter do you think is a more important factor in sea nettle blooms?
2. What do you estimate to be the ideal water temperatue for sea nettles?
3. What do you estimate to be the ideal salinity for sea nettles?
Teachers: if you are short on time you can download the water quality graphs for the Gooses Reef station. Gooses Reef station.